In this tutorial, we are demonstrating step by step example of creating a simple Matrix Report in SSRS.
Need of Matrix Report?
Matrix Reports are required where you have to display some aggregated data and at least one of grouping column need to displayed as column in the report. It is something similar to Pivot we use in normal T-SQL where we convert rows to columns using Pivot.
Now let's have a walk-through of a Matrix Report
Example:
We will create a matrix report where sum of sales will be displayed Year and Product wise in a matrix form and Year will be displayed as columns (similar to pivot in SQL)
We would be using Shared Data source we created in previous article: Shared Data Source
Step 1: Create a Shared Data Source
We would be using this shared data source to fetch the data from the database for the report.
Step 2: Right Click Reports>Add New Report, Report Wizard will appear to configure the report. Click Next.
Step 3: Configure Data Source. Select the Shared Data Source we created in Step 1 and Click Next
Step 4: Design Query either thru Query Builder or write your own query and Click Next.
Step 5: Select Matrix as Report Type and click Next.
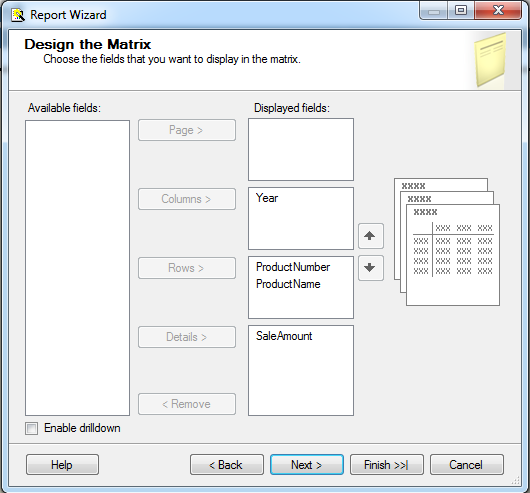
Step 6: All available field will be displayed in Available fields Section. Configure the fields like below by clicking on Columns, Rows & Details buttons respectively.
Step 7: Here, you can select Table Style. Default Style is Slate. Click Next
Step 8: At this stage, we are done with configuration of reports. Change the Report Name to YearProductWiseSale and Click Finish.
Step 9: Click Finish will create a report. You can configure design part like color, height, width etc..manually
We are done with creating a Simple Matrix Report. Let's run the report and see the output.
To run the report, set this report as StartItem in Project Properties.
Right Click Project>Properties. Select the report we just created as StartItem.
Now let's run the project and see the output of the report
Need of Matrix Report?
Matrix Reports are required where you have to display some aggregated data and at least one of grouping column need to displayed as column in the report. It is something similar to Pivot we use in normal T-SQL where we convert rows to columns using Pivot.
Now let's have a walk-through of a Matrix Report
Example:
We will create a matrix report where sum of sales will be displayed Year and Product wise in a matrix form and Year will be displayed as columns (similar to pivot in SQL)
We would be using Shared Data source we created in previous article: Shared Data Source
Step 1: Create a Shared Data Source
We would be using this shared data source to fetch the data from the database for the report.
Step 2: Right Click Reports>Add New Report, Report Wizard will appear to configure the report. Click Next.
Step 3: Configure Data Source. Select the Shared Data Source we created in Step 1 and Click Next
Step 4: Design Query either thru Query Builder or write your own query and Click Next.
select  P.ProductNumber, P.Name as ProductName
        , YEAR(SOH.OrderDate) as Year, SOD.LineTotal as SaleAmount
from    Sales.SalesOrderDetail SOD
inner join Sales.SalesOrderHeader SOH on SOH.SalesOrderID = SOD.SalesOrderID
inner join Production.Product P on P.ProductID = SOD.ProductID
Step 5: Select Matrix as Report Type and click Next.
Step 6: All available field will be displayed in Available fields Section. Configure the fields like below by clicking on Columns, Rows & Details buttons respectively.
- Year Field moved to Columns as it is to be displayed as Column
- ProductNumber & ProductName Fields moved to Rows as they are to be displayed as Rows
- SalesAmount to Details as it is to be aggregated based on Year and Product.
Step 7: Here, you can select Table Style. Default Style is Slate. Click Next
Step 8: At this stage, we are done with configuration of reports. Change the Report Name to YearProductWiseSale and Click Finish.
Step 9: Click Finish will create a report. You can configure design part like color, height, width etc..manually
We are done with creating a Simple Matrix Report. Let's run the report and see the output.
To run the report, set this report as StartItem in Project Properties.
Right Click Project>Properties. Select the report we just created as StartItem.
Now let's run the project and see the output of the report


No comments:
Write Comments